Back to projects
Ultrasound · Signal processing

Pixel Probe

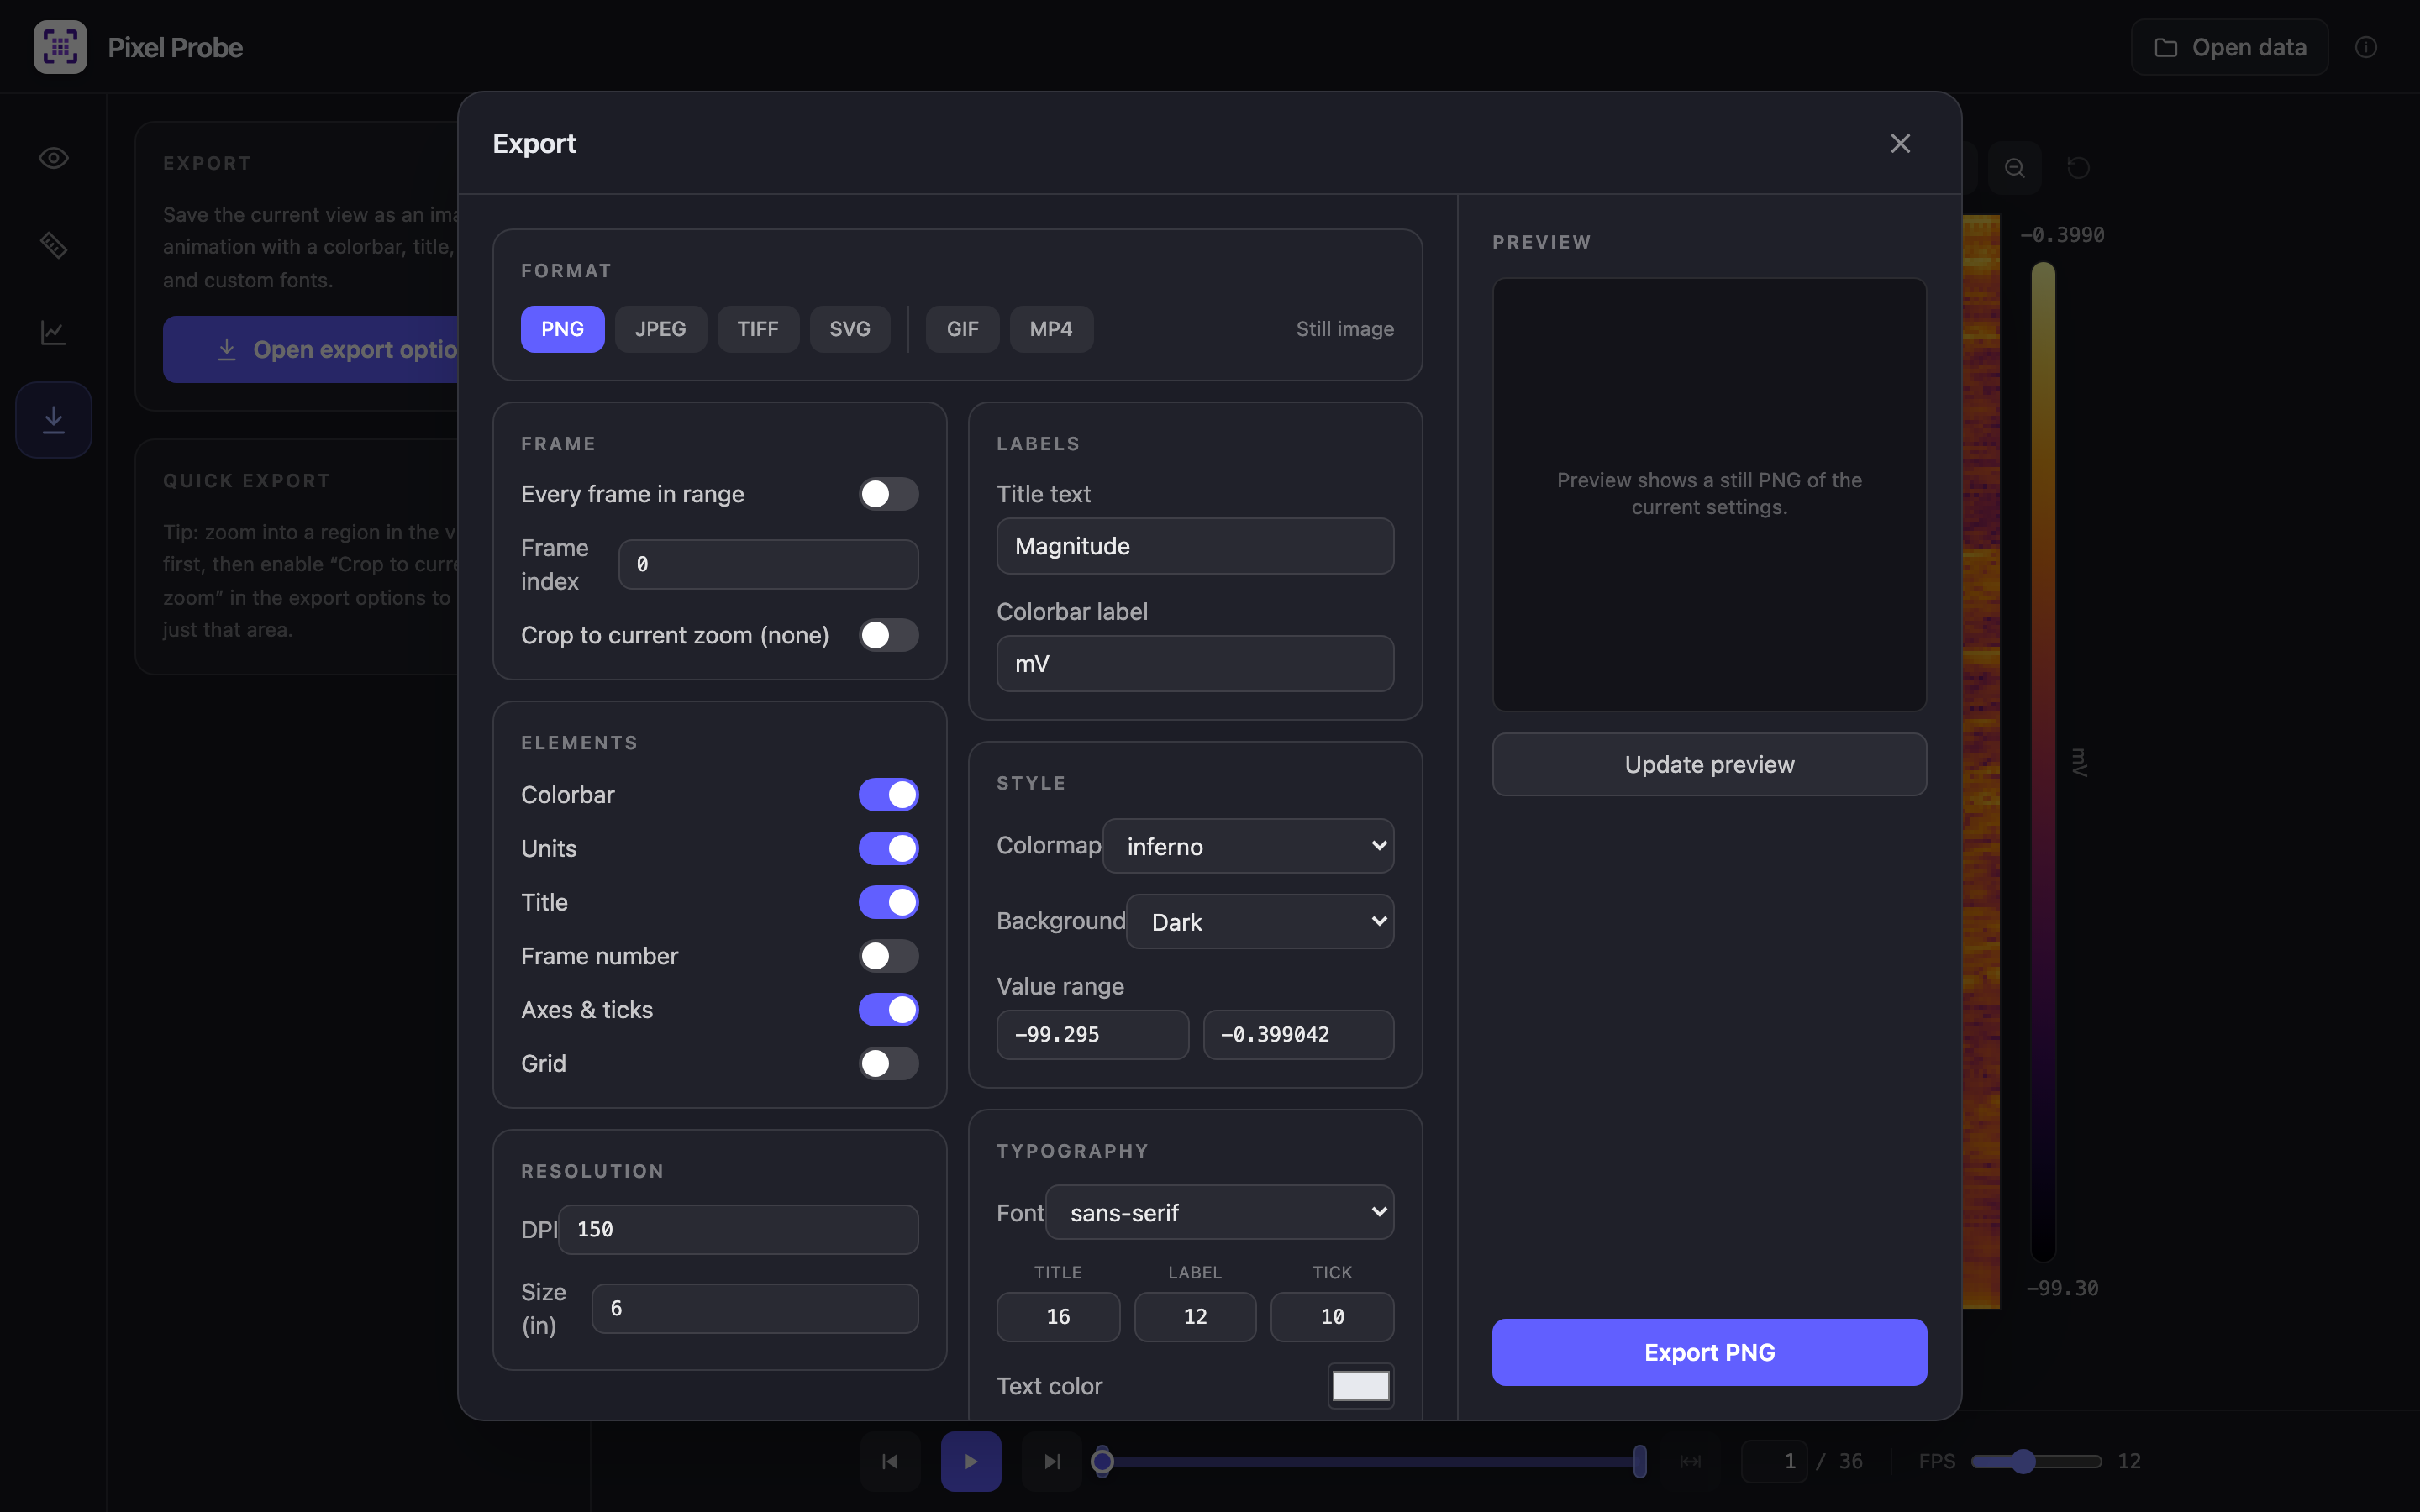
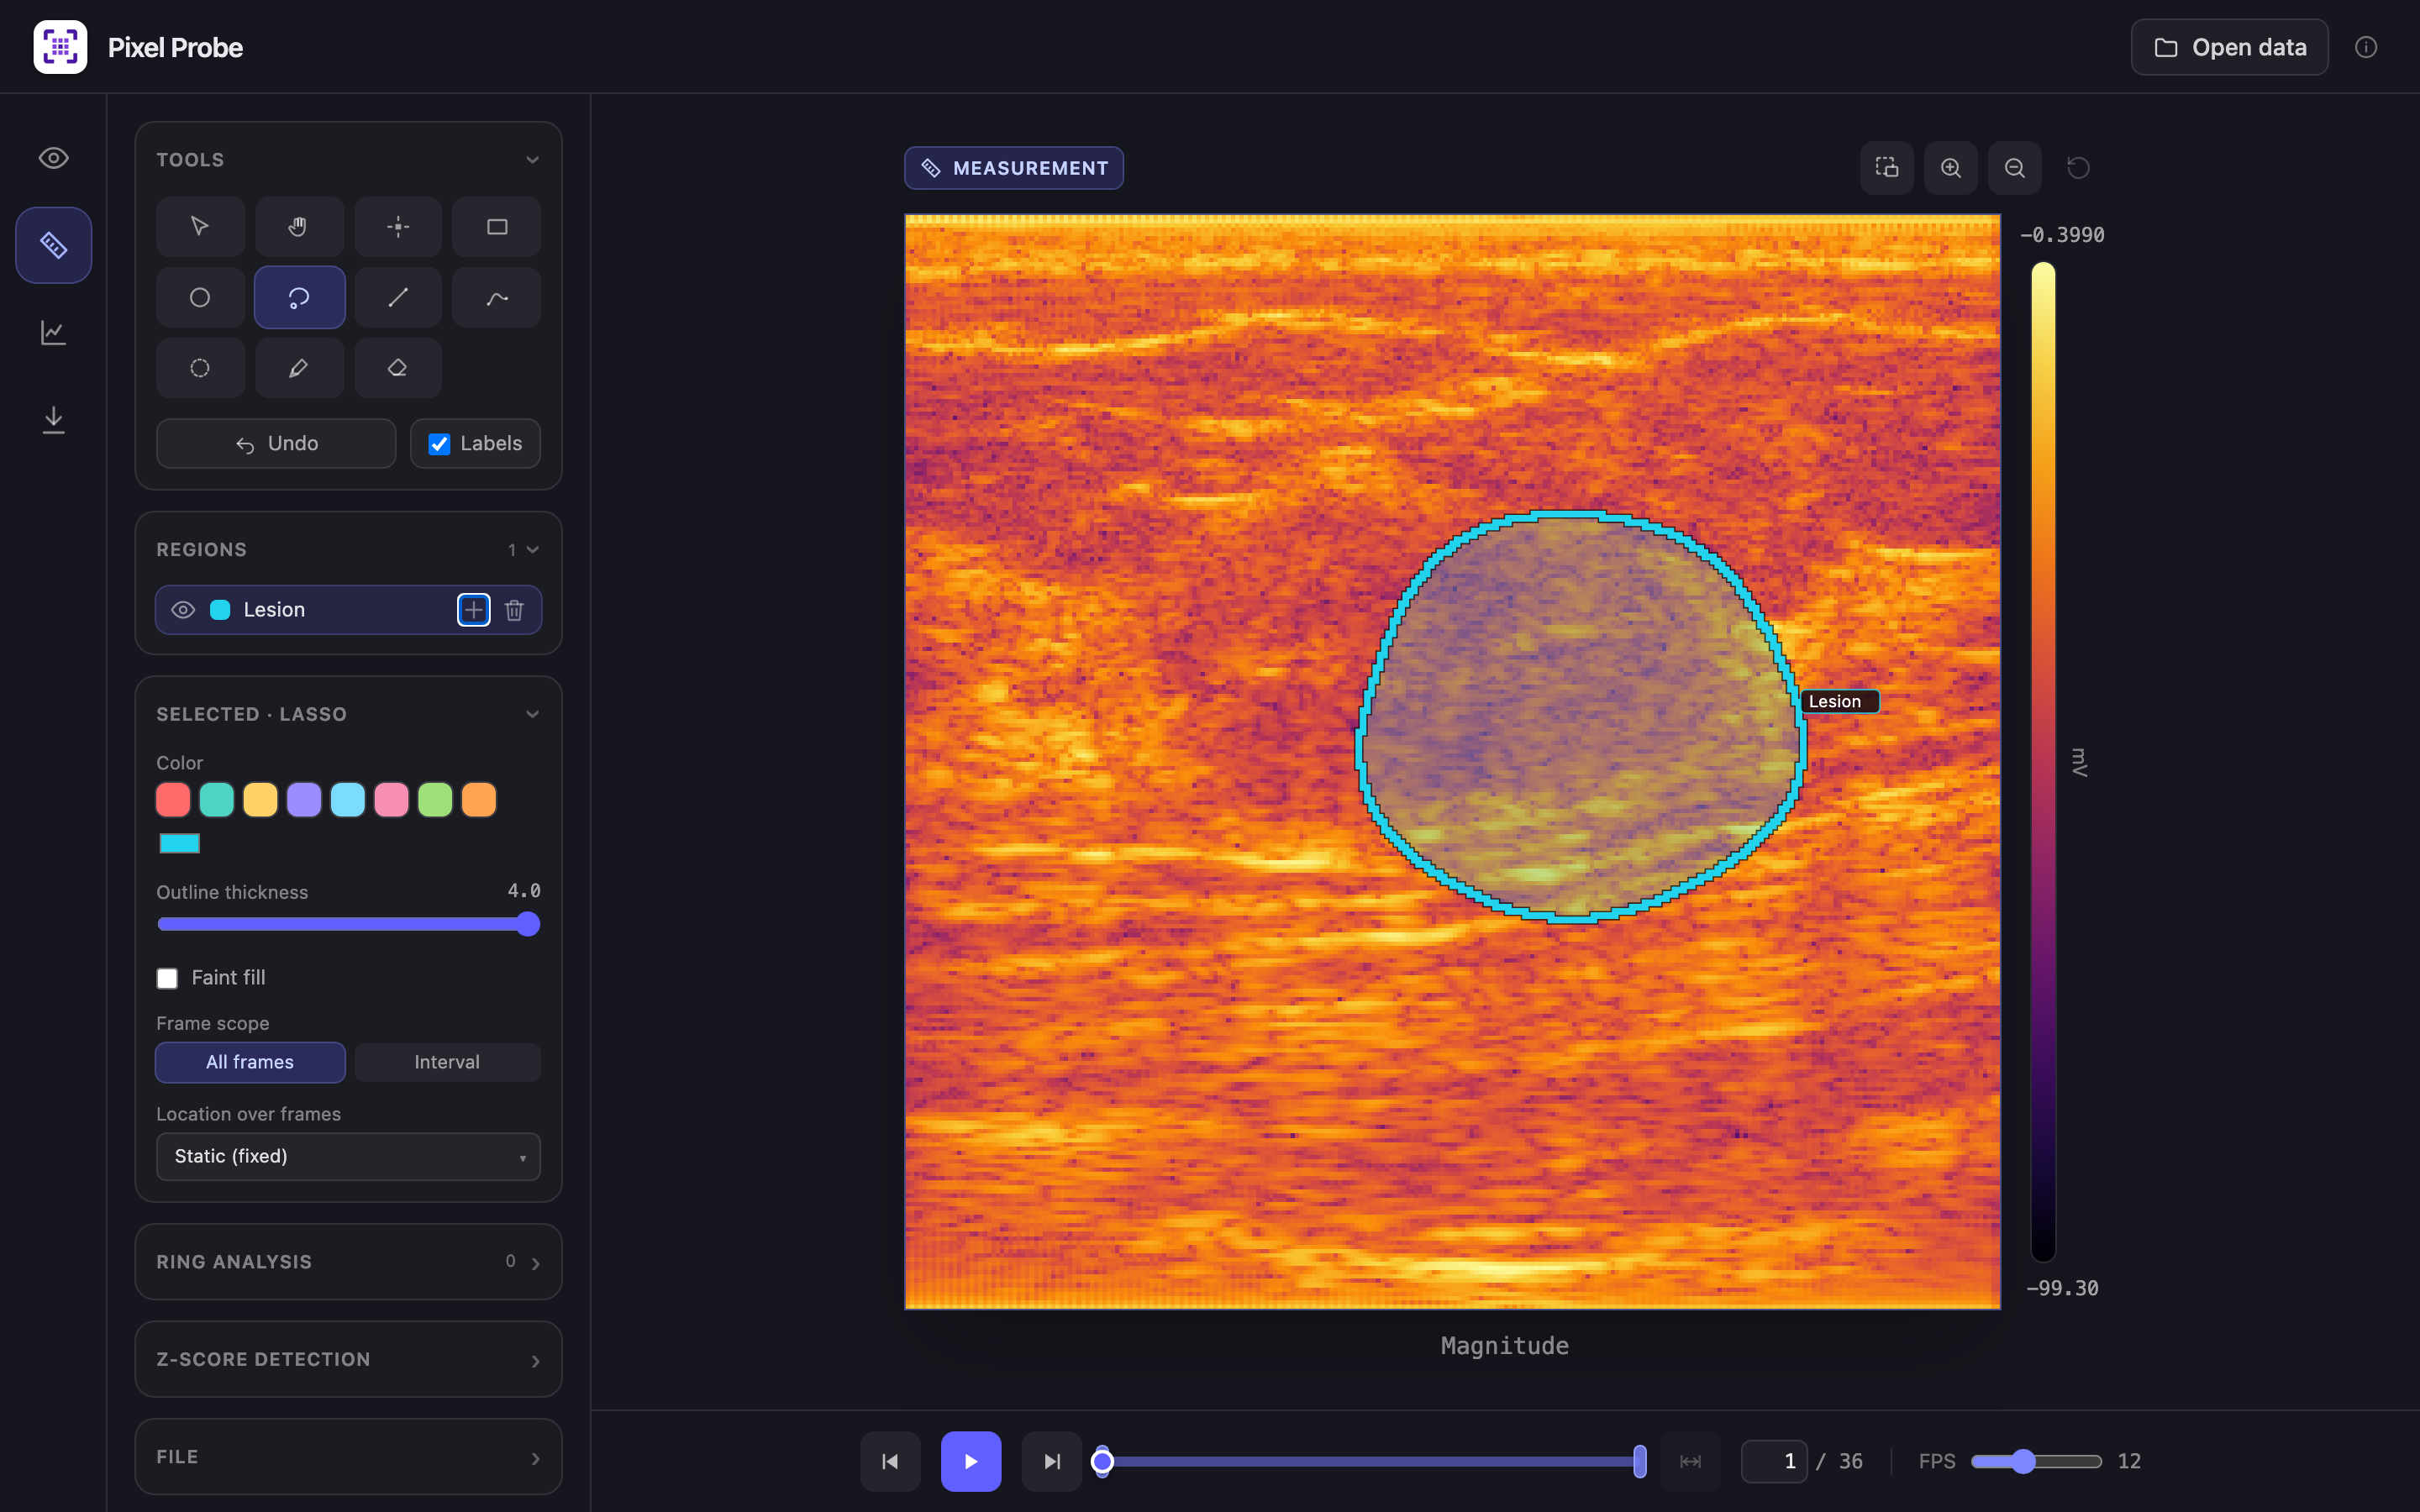
A cross-platform desktop application for analyzing radio-frequency (RF) ultrasound data, from raw-echo demodulation through region-of-interest measurement, automated detection, and publication-ready figure, video, and CSV export. (Disclaimer: For research use only, not intended for medical use.)

Python · FastAPI React + TypeScript Electron macOS / Windows
Pixel Probe — Measurement
Measurement view with a freehand lasso region drawn around a breast lesion, labeled Lesion
01Raw RFPulse-echo signal
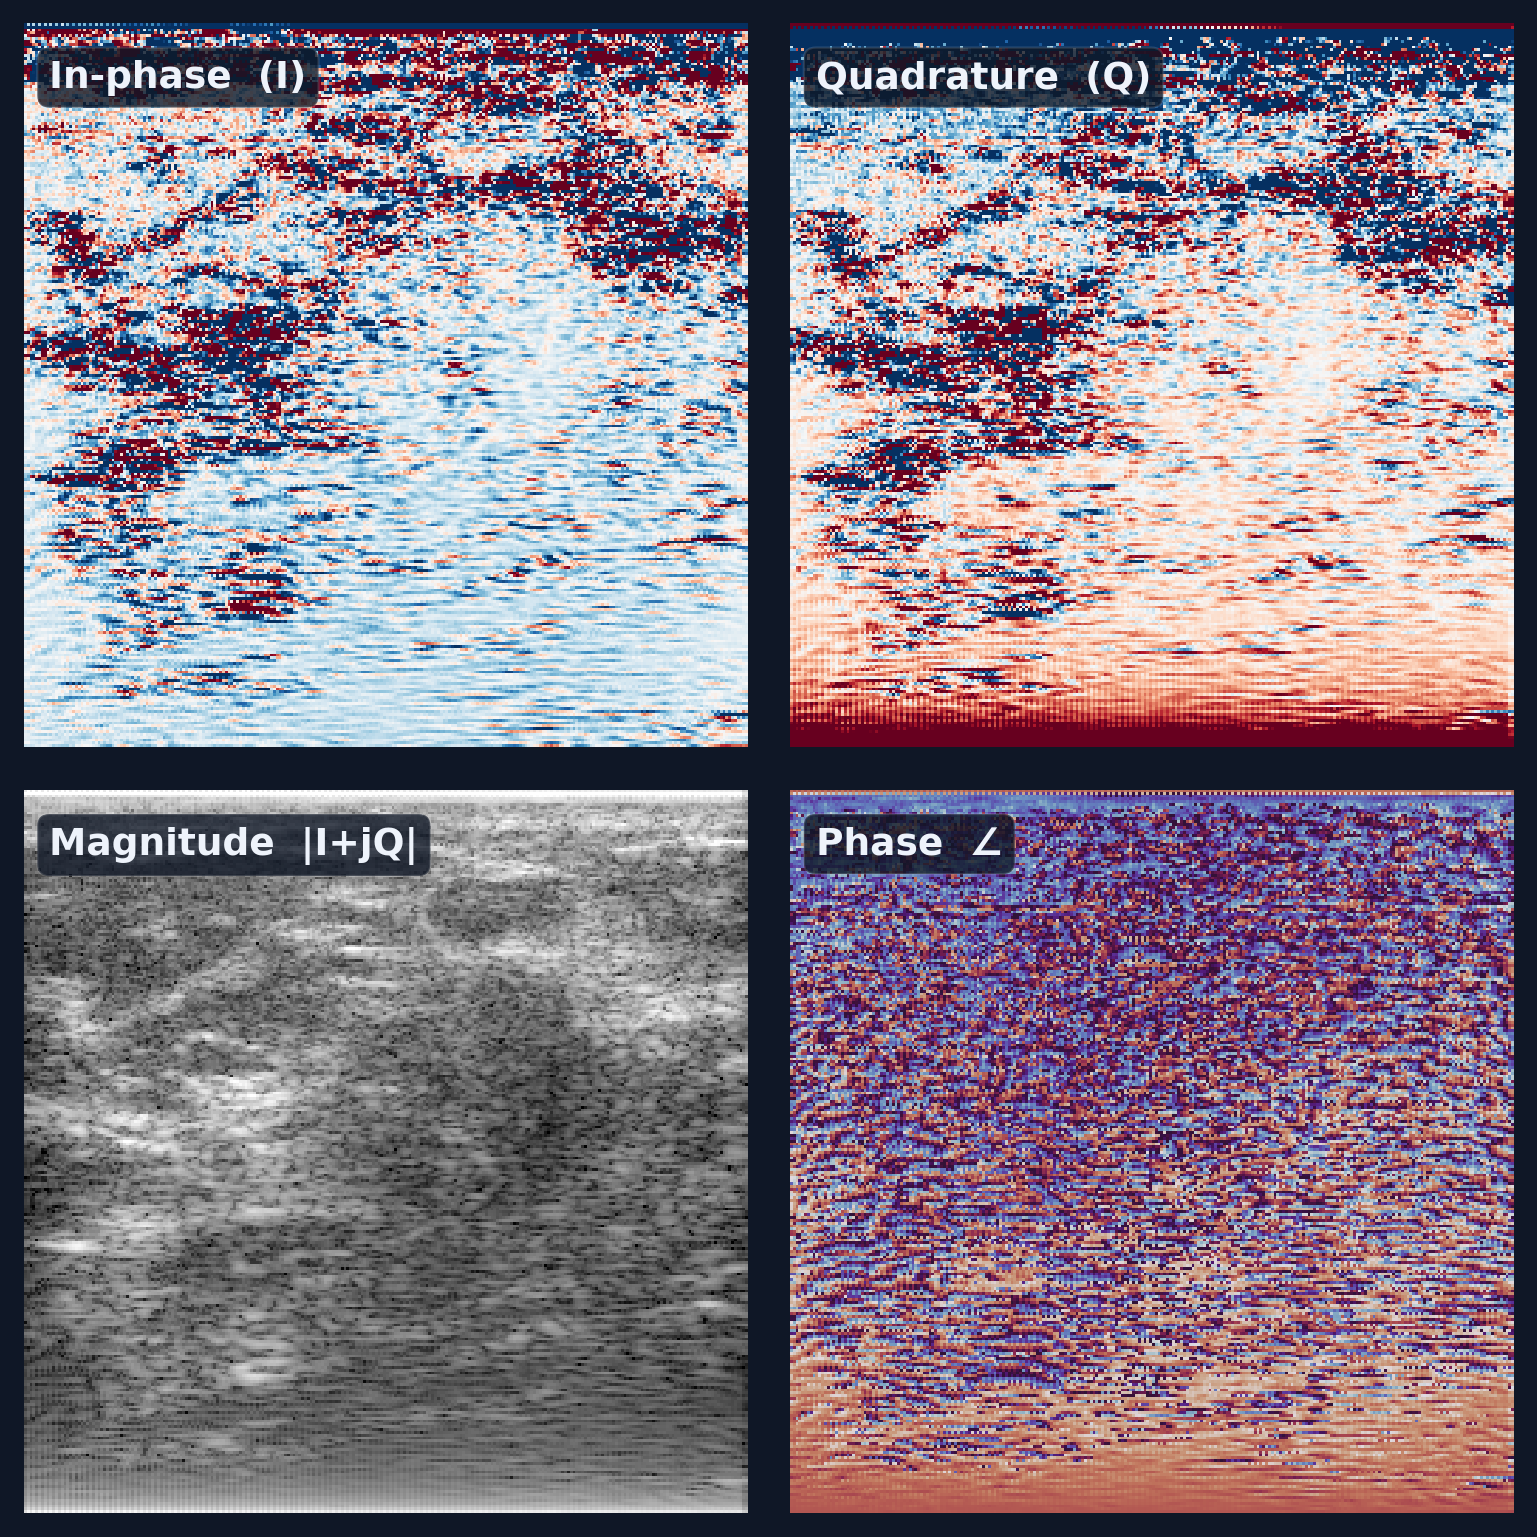
02DemodulationIn-phase, Quadrature
03EnvelopeMagnitude, Phase
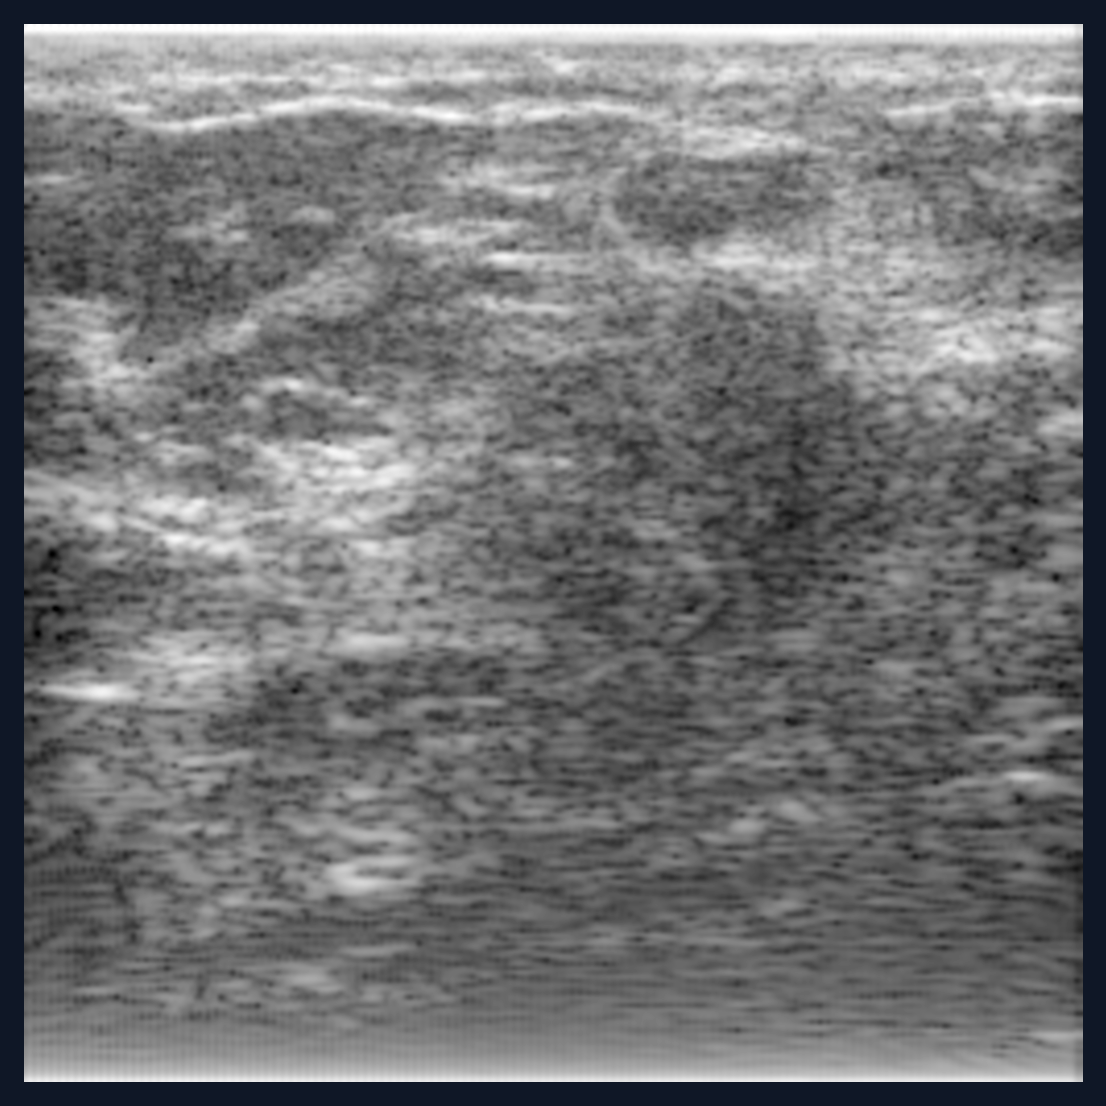
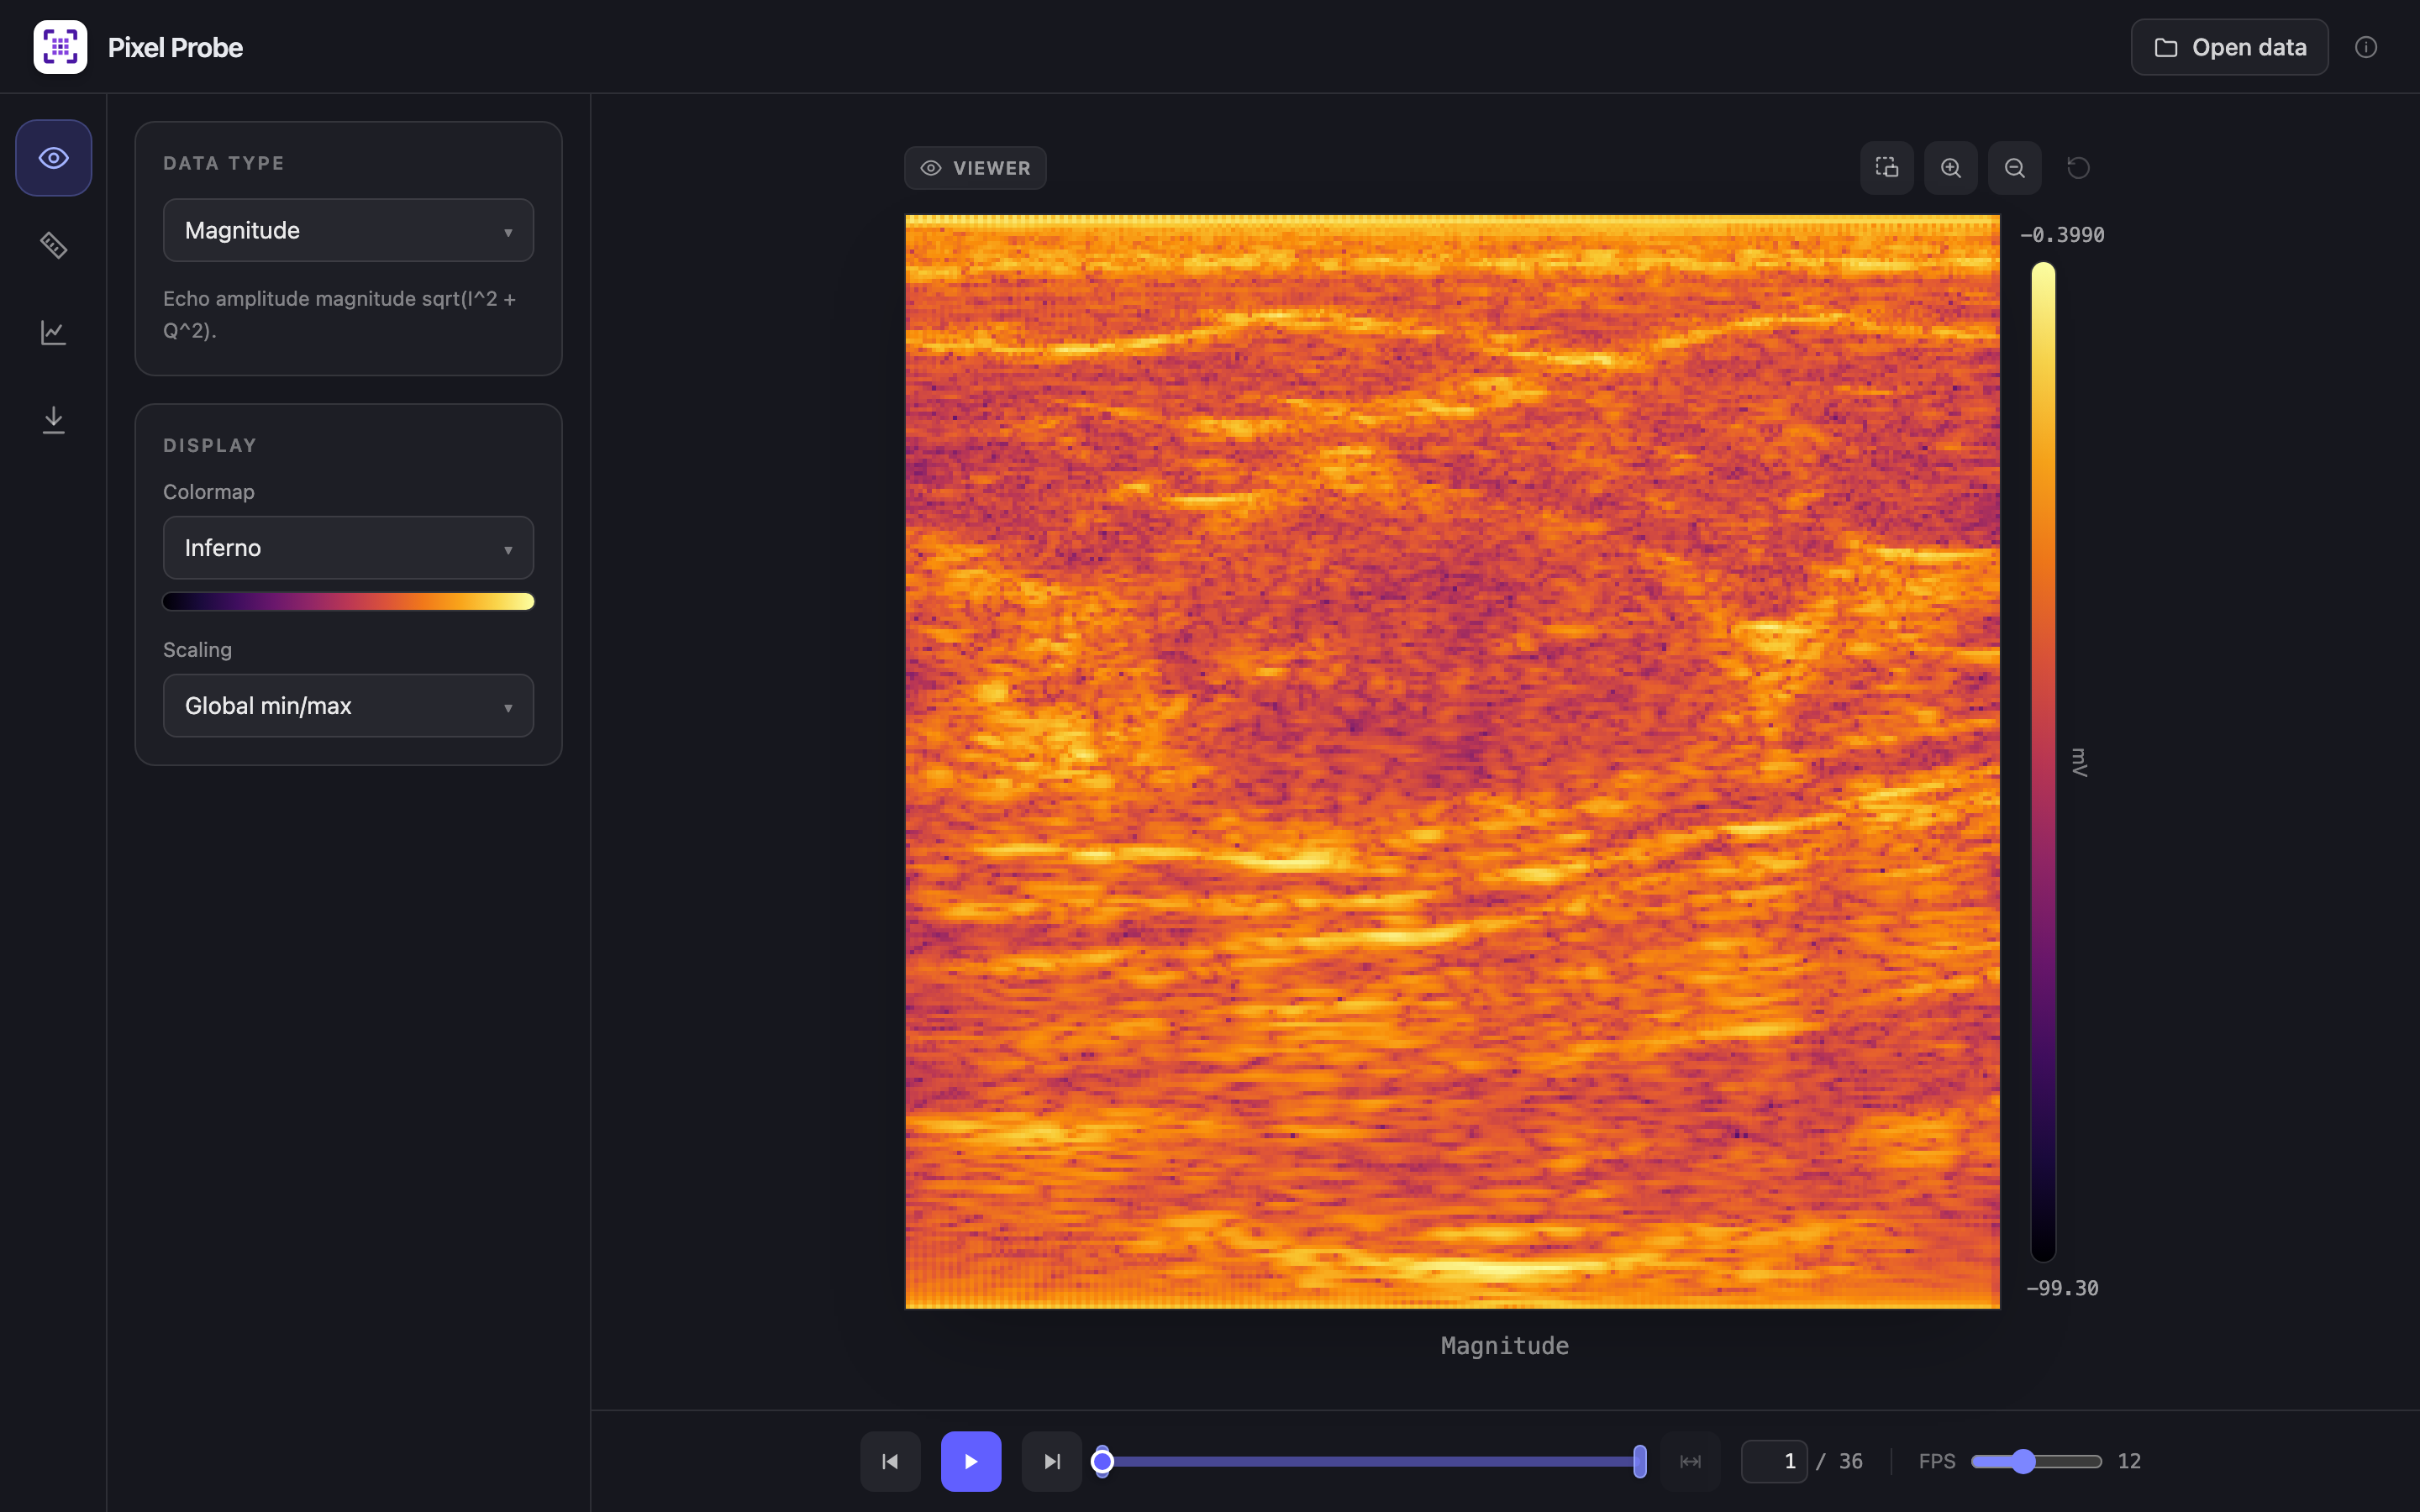
04B-modeLog-compressed
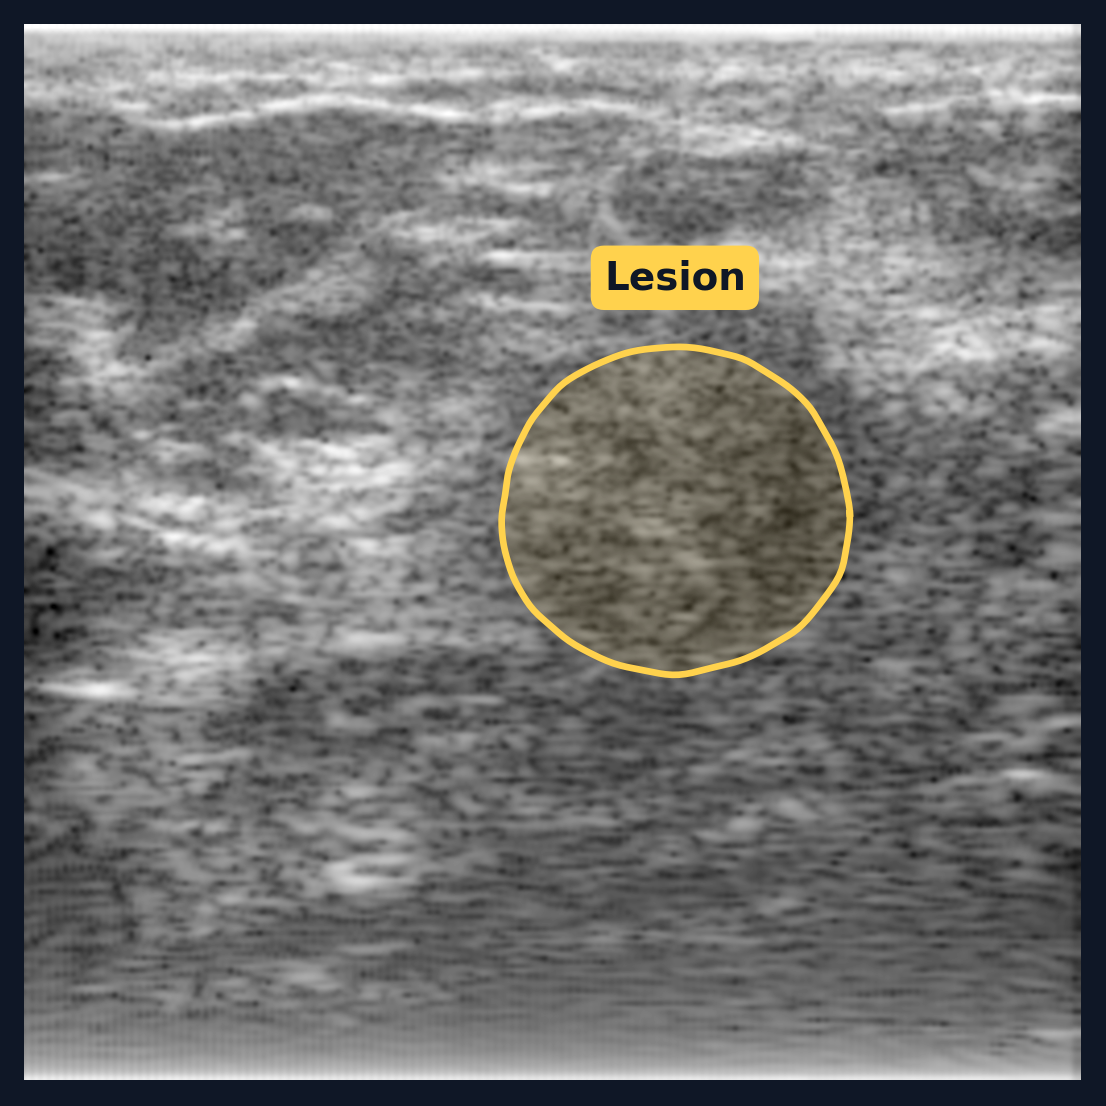
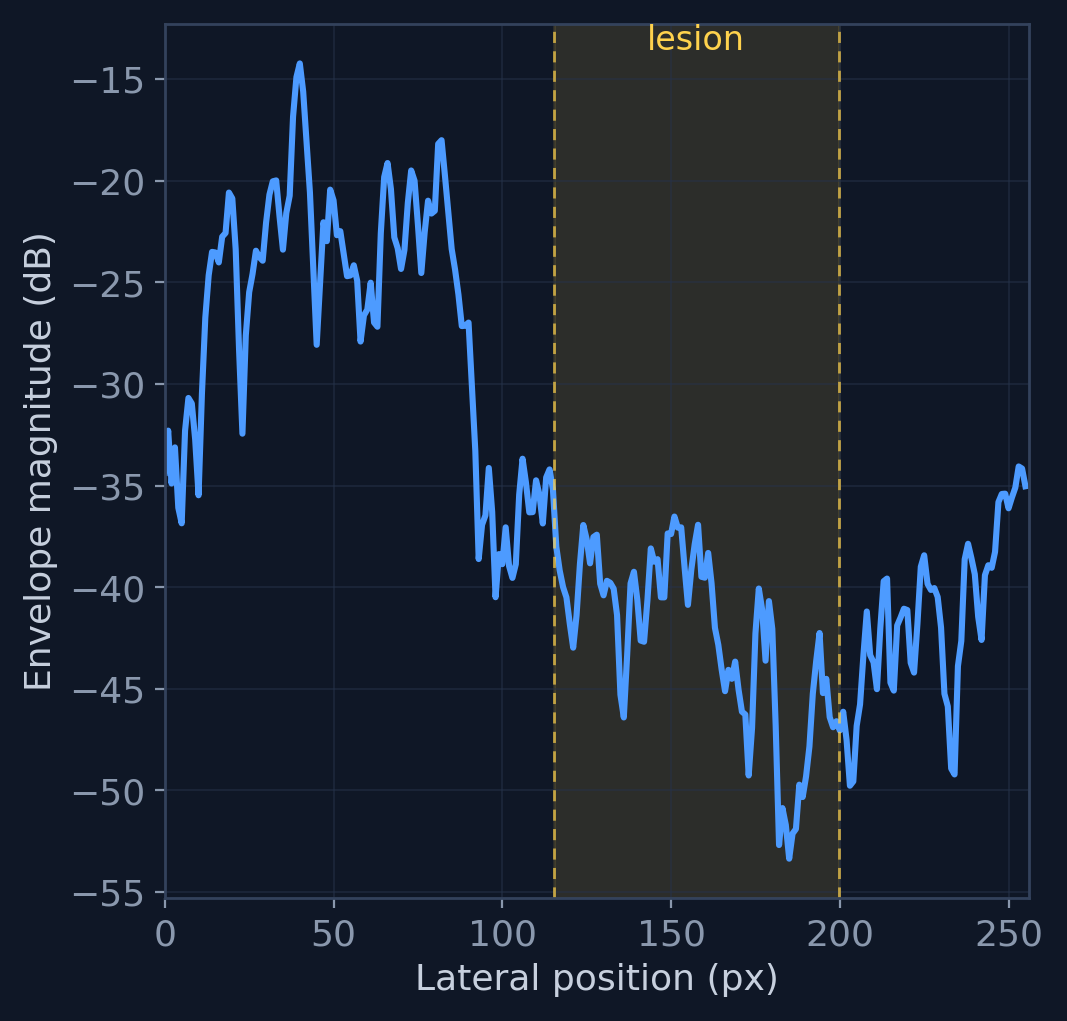
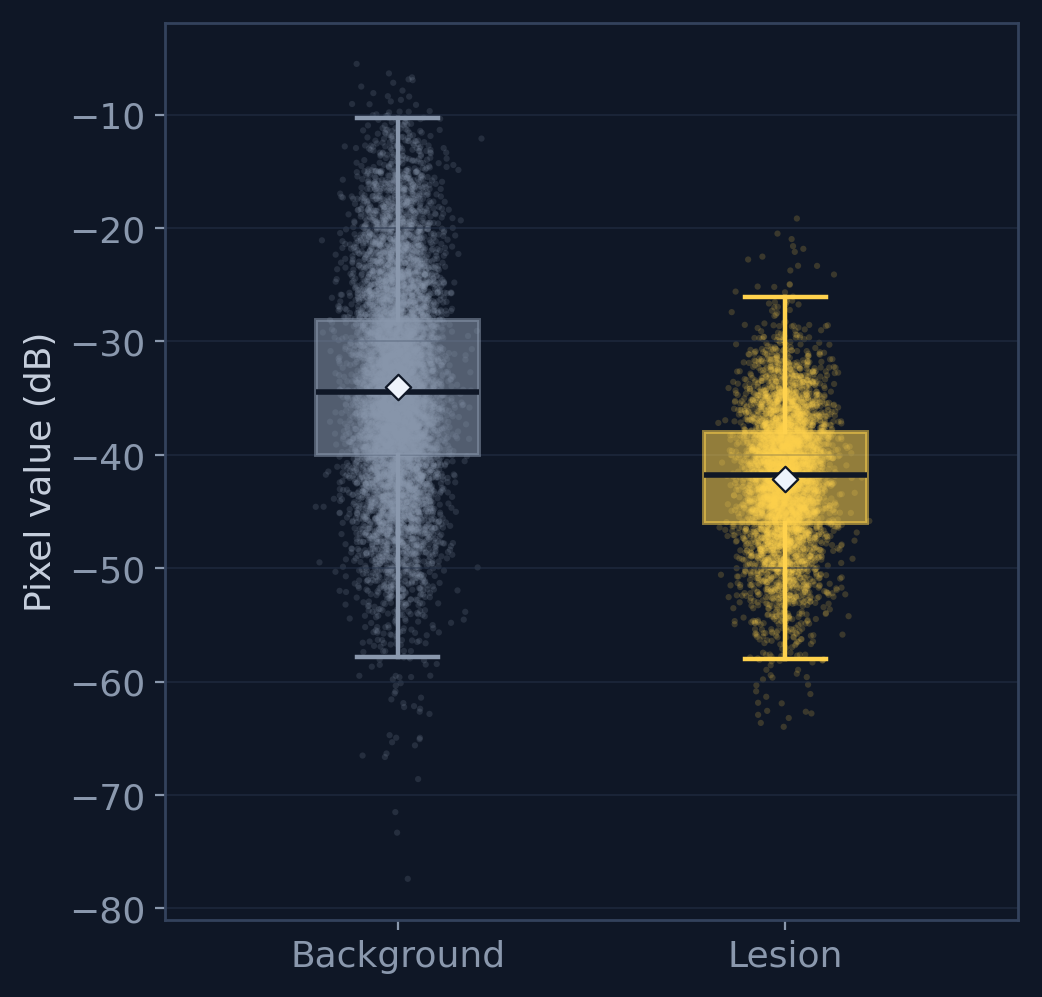
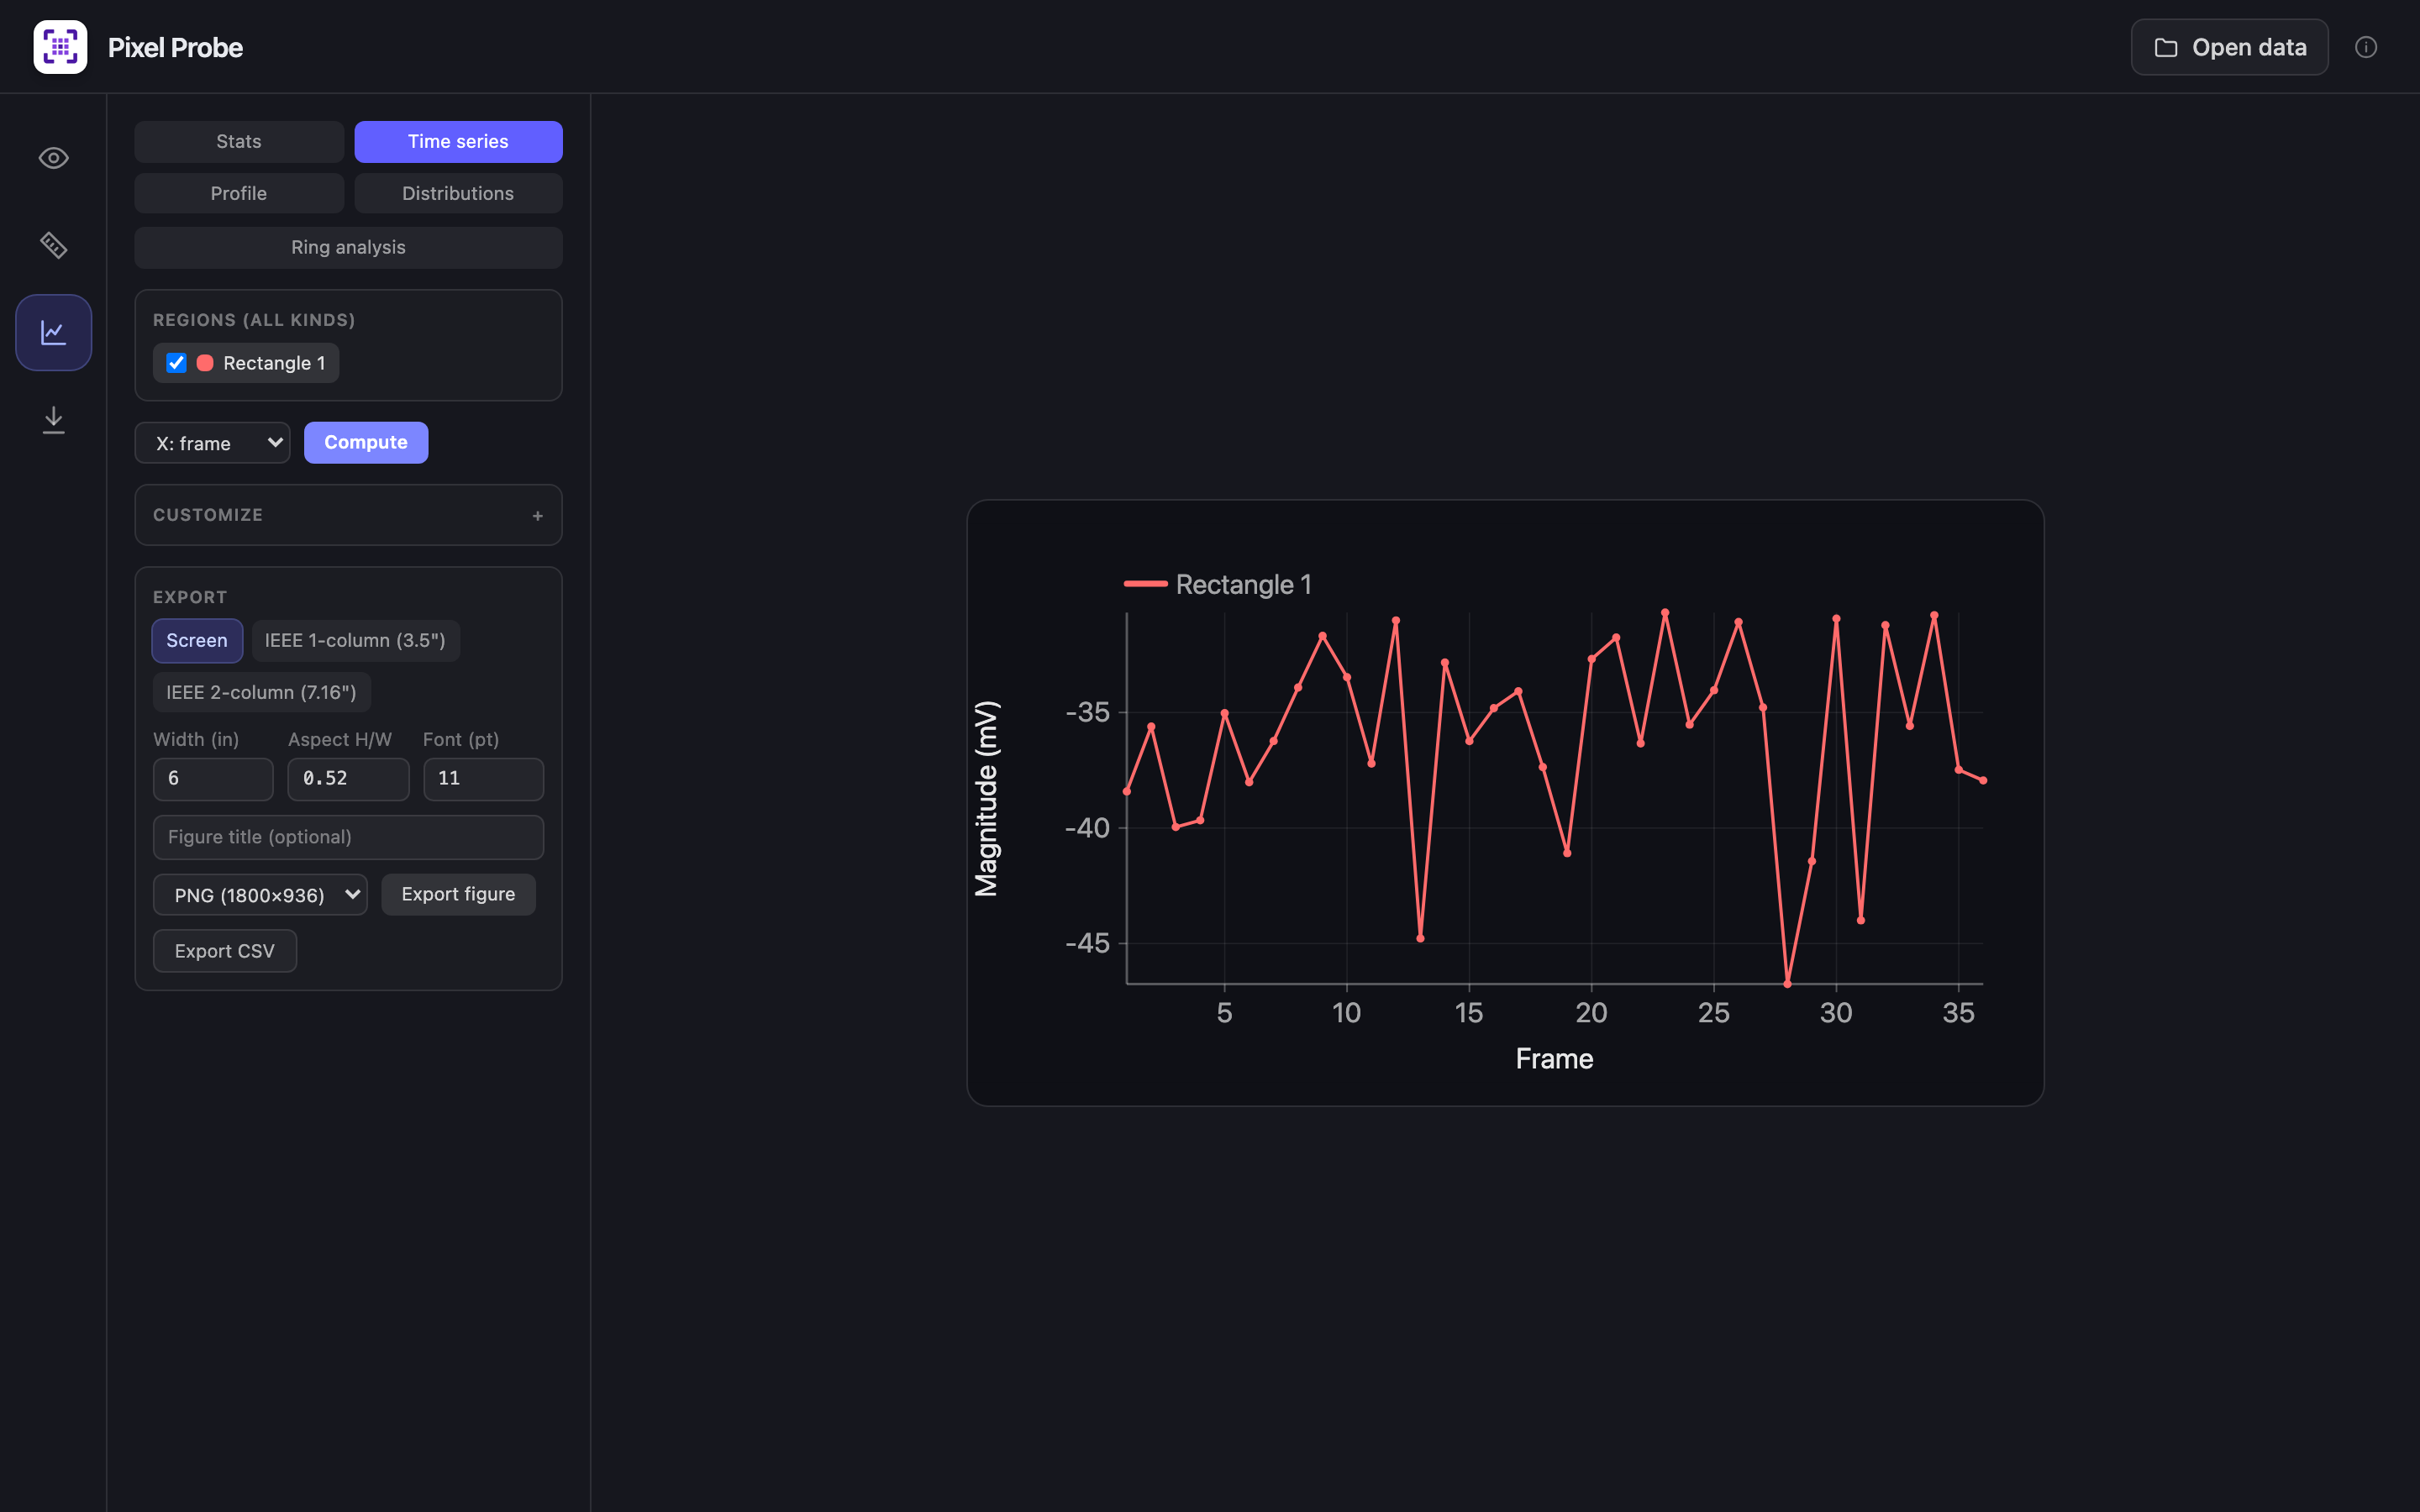
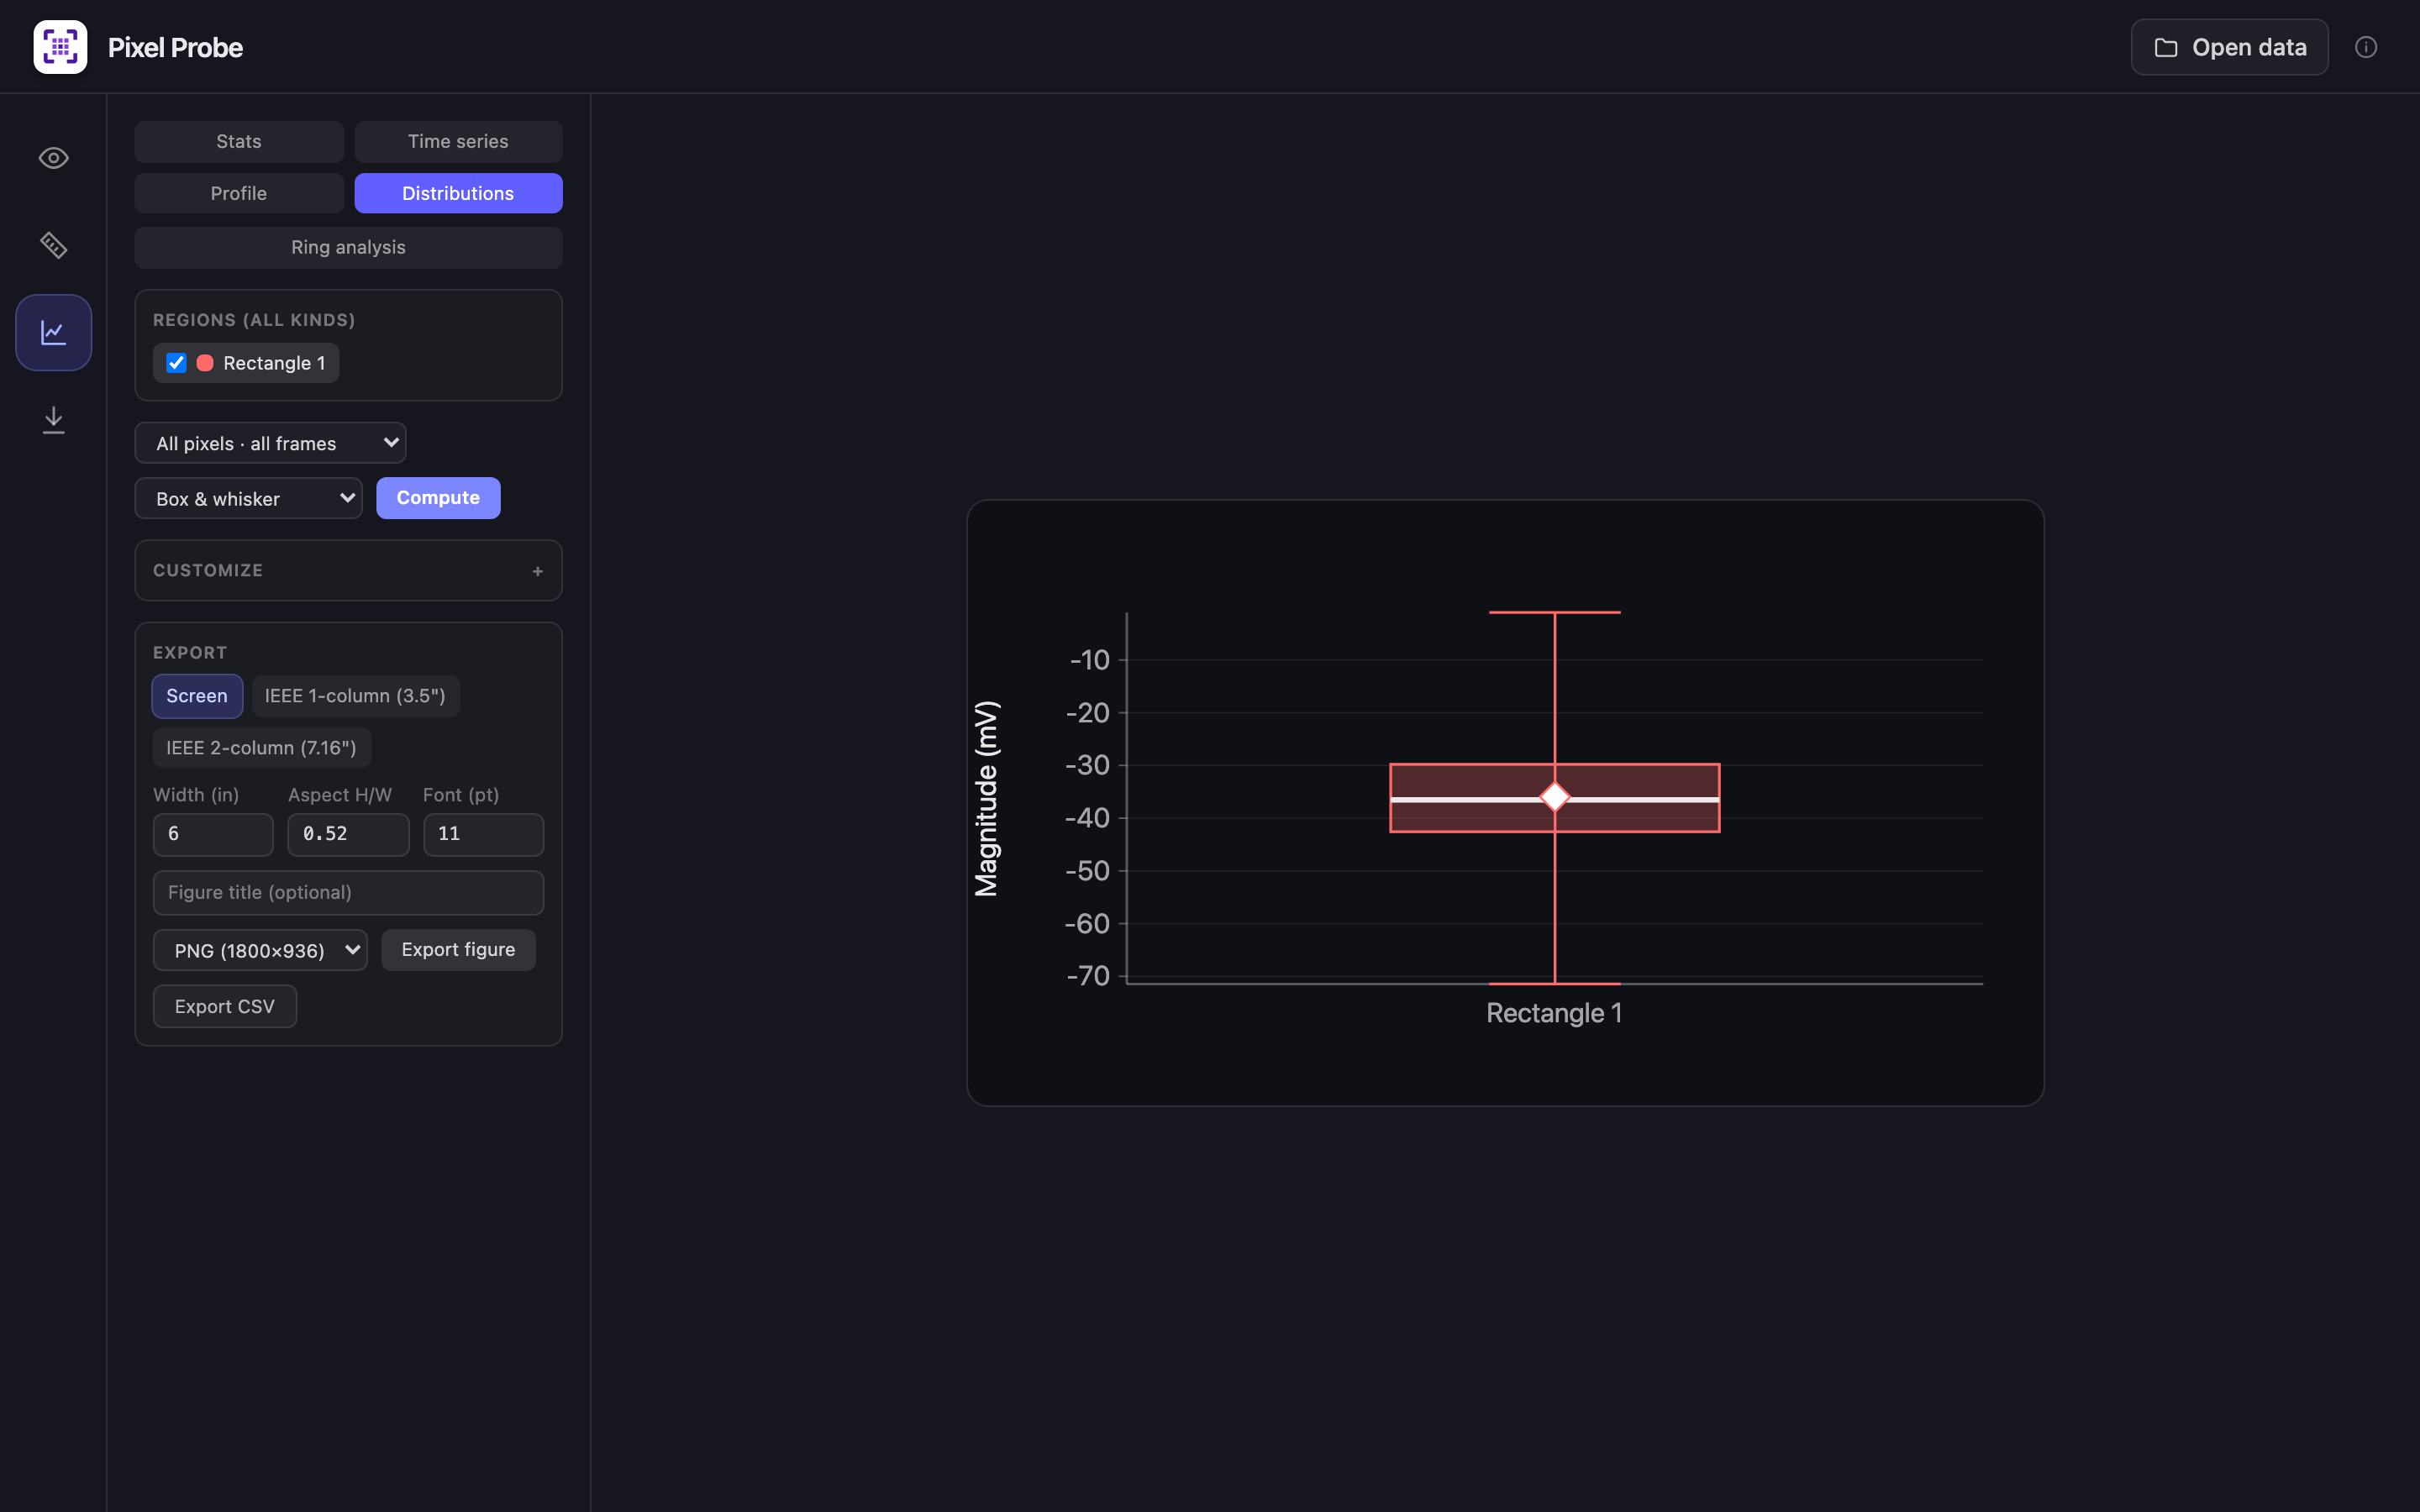
05ROI analysisStats, plots, export
Capabilities

From raw echoes to publication figures

Pixel Probe covers the full post-processing path for pulse-echo ultrasound in a single tool.

01

Demodulation

Recovers in-phase, quadrature, envelope (B-mode) magnitude, and phase from raw RF echoes. Each is a selectable channel with perceptual colormaps and calibrated colorbars.

02

Region measurement

Rectangle, ellipse, lasso, line/path, and brush tools with per-frame ROI tracking, feeding time-series, spatial-profile, and distribution analysis.

03

Automated detection

Temporal and spatial thresholding with connectivity-based speckle denoising and more image processing features including upcoming human-in-the-loop segmentation tools.

04

Export & packaging

Publication-ready figure, video, and CSV export with IEEE presets. Ships in the standalone build bundling the export tools

Signal processing

Demodulating raw RF into imaging channels

Raw radio-frequency echoes are demodulated into in-phase, quadrature, envelope, and phase channels, then analyzed for region-level statistics.

Four panels: in-phase, quadrature, magnitude, and phase channels
Demodulation channels. In-phase, quadrature, envelope magnitude (B-mode), and phase recovered from raw RF.
Reconstructed B-mode ultrasound image
B-mode reconstruction. Log-compressed envelope of the demodulated signal.
Lesion outlined on a B-mode image
Region delineation. Hypoechoic lesion outlined for measurement.
Lateral magnitude profile across the lesion
Spatial profile. Lateral magnitude across the region shows the hypoechoic dip.
Pixel-value distribution comparing lesion and background
Value distribution. Lesion versus background pixel statistics.
Inside the app

A focused, modern analysis workspace

A navigation rail switches between viewing, measurement, analysis, and export. Each mode provides its own toolset and keeps the process flow organized.

Measurement
Measurement view with a freehand lasso region drawn around a lesion, labeled Lesion
Measurement. Freehand ROI selection over a lesion, with per-region tools, naming, and per-frame tracking.
Viewer
Viewer with channel selection, colormap, scaling and playback
Viewer. Channel selection, colormap, scaling, frame playback, and a units-aware colorbar.
Analysis
Time-series analysis plot with export presets
Analysis. Interactive plots with per-trace styling and IEEE export presets.
Distributions
Box-and-whisker distribution plot for a region
Distributions. Box, violin, and point plots for pixel and frame-averaged values.
Export
Export dialog with format, elements and typography controls
Export. Image and video formats with colorbar, axes, fonts, DPI, and a live preview.
Built with

Technology

Python NumPy / SciPy DSP · Hilbert demodulation FastAPI React + TypeScript Electron Matplotlib

Demonstration data (raw RF, demodulated to the channels shown): H. Piotrzkowska-Wróblewska, K. Dobruch-Sobczak, M. Byra, A. Nowicki, “Open access database of raw ultrasonic signals acquired from malignant and benign breast lesions,” Medical Physics 44(11):6105–6109, 2017. doi:10.1002/mp.12538 · dataset on Zenodo (CC BY 4.0).